Loading
Related Articles
Fed Rate Hikes Are Back in 2026: What a Return to Tightening Means for the Dollar, Gold, and Traders
Related Articles
Fed Rate Hikes Are Back in 2026: What a Return to Tightening Means for the Dollar, Gold, and Traders

TrustFinance
Nov 13, 2026
18 min read
12

On 17 August 2026, Thailand's Office of the National Economic and Social Development Council (NESDC) announced that the Thai economy "expanded by 1.9 percent" in the second quarter of 2026. Yet the same document also said the economy "declined by 0.2 percent" compared with the first quarter. At a glance the two numbers seem to contradict each other. In fact both are correct; they simply measure different things (NESDC).
That is exactly why it pays to know what GDP is, what it measures and what it is compared against. Without that, two people can read the same economic headline and come away with opposite conclusions. This article walks you through the meaning of GDP, how it is calculated, and how to read real GDP figures, using Thailand's latest data from NESDC as the example.
|
If you want a short answer to "what is GDP?", think of it as the "combined receipt of an entire country" for one quarter or one year. Every time something is produced and sold to its final user, that value is counted in GDP, whether it is a bag of rice, a new car or a haircut.
What is left out matters just as much. Buying and selling a second-hand house, shares changing hands on the stock market, or money the government transfers to people without anything new being produced are not counted in GDP, because no new goods or services are created. The agent's commission on a second-hand house sale does count, though, because it is a service actually provided in that period.
| Counted in GDP | Not counted in GDP |
|---|---|
| Final goods and services, such as rice, cars and haircuts | Buying and selling a second-hand house |
| The agent's commission on a second-hand house sale | Shares changing hands on the stock market |
| The value added at each stage of production | Government transfers to people with no new production |
Another common point of confusion is time. GDP is a "flow", not a "stock". It measures how much was produced in this quarter or this year, not how much wealth a country has built up. A country with a high GDP is therefore not always a country with high accumulated wealth.
Think of a loaf of bread. A farmer sells wheat to a mill, the mill sells flour to a bakery, and the bakery sells bread to a customer. If you added up the price at every stage, the value of the wheat would be counted several times. So GDP counts only the price of the bread sold to the final customer, or, equivalently, only the "value added" at each stage. Both methods give the same result.
"Domestic" means what is produced on a country's own soil. Take Thailand: a car built at a Japanese-owned factory in Chonburi counts toward Thailand's GDP, but a restaurant a Thai person opens in London does not. If you want to measure output by the nationality of whoever owns the factors of production, you need GNP or GNI, which are separate indicators.
The idea is simple. Every baht or dollar someone spends on a purchase becomes someone else's income, and it is also the value of something that was produced. So whichever angle you measure from, you arrive at the same GDP.
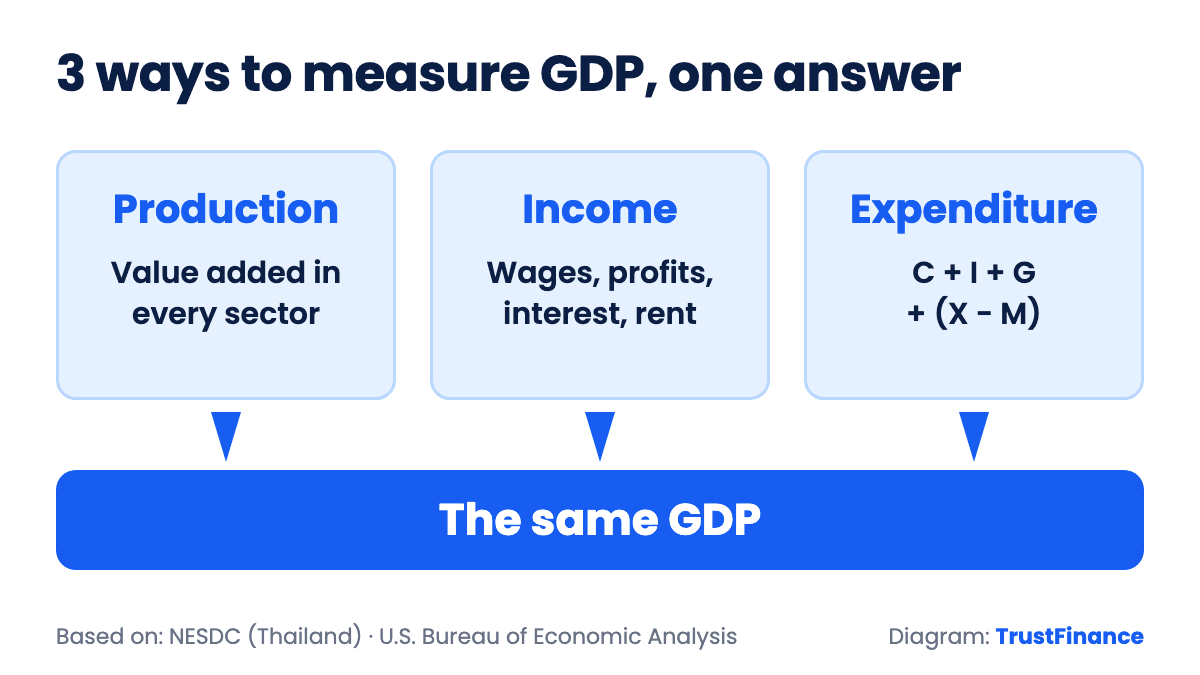
Image: 3 ways to measure GDP · Source: diagram by TrustFinance Research Team, based on principles from NESDC and the BEA
This approach adds up the value added by every sector of the economy, such as agriculture, manufacturing, construction, retail, tourism and finance. It helps answer which sectors an economy depends on and which ones are slowing down.
For example, in its Q2 2026 release, NESDC reported that agriculture, manufacturing, accommodation and food services, wholesale and retail trade, transport, and construction all slowed from the previous quarter. Data like this comes straight from the production approach. If you work or invest in tourism or retail, the sector figures may mean more to you than the headline number for the whole country.
This approach adds up the income generated by production: workers' wages, business profits, interest and rent. It shows how the value produced is split between labour and profit.
This is the GDP formula most people know, and the one economic news reports use most often.
Imports have to be subtracted because they are already counted inside C, I or G, but they were not produced in the country. Without subtracting them, GDP would be overstated.
Formula: GDP = C + I + G + (X - M) Example (made-up numbers): Here is a simple example with round numbers. A country has consumption of 60 units, investment of 20 units, government spending of 15 units, exports of 70 units and imports of 65 units. GDP equals 60 + 20 + 15 + (70 - 65) = 100 units. Notice that exports and imports are both very large, yet only 5 units actually end up in GDP. That is why a country that relies heavily on international trade, such as Thailand, needs to watch both sides at the same time. |
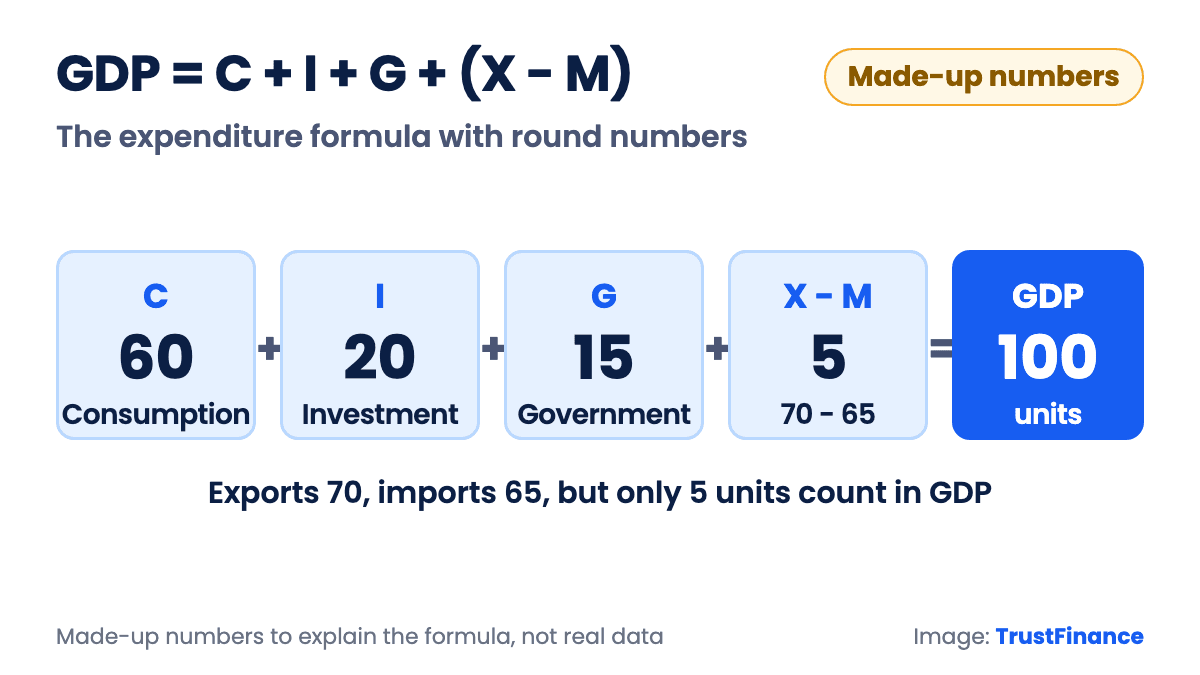
Image: the GDP expenditure formula with a made-up example · Source: image by TrustFinance Research Team based on the example in this article (made-up numbers, not real data)
Nominal GDP is calculated using market prices at the time. Real GDP removes the effect of price changes. The US Bureau of Economic Analysis (BEA) explains that real GDP is adjusted to remove the effects of inflation, which makes it possible to compare across time periods (BEA).
If the price side of GDP still feels confusing, try a simple example. Suppose a country produces the same amount of rice this year, but the price of rice rises 10%. Nominal GDP grows 10% even though output has not increased at all. Real GDP tells the true story: 0% growth. Inflation is what drives the two numbers apart. (You can read more about price measures such as CPI in a separate article.)
The ratio between nominal GDP and real GDP is called the GDP deflator. It measures the price level of the whole economy. Unlike CPI, it covers every good and service produced in the country, not just the basket of items households buy.
| Topic | Nominal GDP | Real GDP |
|---|---|---|
| Prices used | Market prices at the time | Effect of price changes removed |
| Effect of inflation | Includes the effect of prices | Removes inflation, so periods can be compared |
| Same rice output, price up 10% (made-up numbers) | Up 10% | Up 0% |
| Name used in NESDC data (Thailand) | GDP at current market prices | CVM (Chain Volume Measures) |
When a headline says "GDP grew 1.9%", that is the rate of change in real GDP. In Thailand, NESDC uses the term CVM (Chain Volume Measures), which is a chain-linked volume measure of real GDP. The baht values you see in the annual tables are usually GDP at current market prices, in other words nominal GDP.
Back to the numbers that seemed to clash at the start. The 1.9% is YoY: Q2 2026 compared with Q2 2025. The 0.2% decline is seasonally adjusted QoQ: a comparison with the previous quarter after removing seasonal effects (NESDC). What it really means is that the economy is still larger than it was a year ago, but its short-term momentum is starting to fade. If QoQ is negative for two quarters in a row, many analysts start calling it a technical recession.
According to NESDC's press release of 17 August 2026, these are the key figures for Thailand:
Looking back at each quarter of 2025, the numbers moved around quite a bit. Growth was 3.1% in the first quarter and 2.8% in the second, dropped to 1.2% in the third, then came back to 2.5% in the fourth. Looking at several quarters in a row like this shows the trend far better than getting excited about a single quarter.
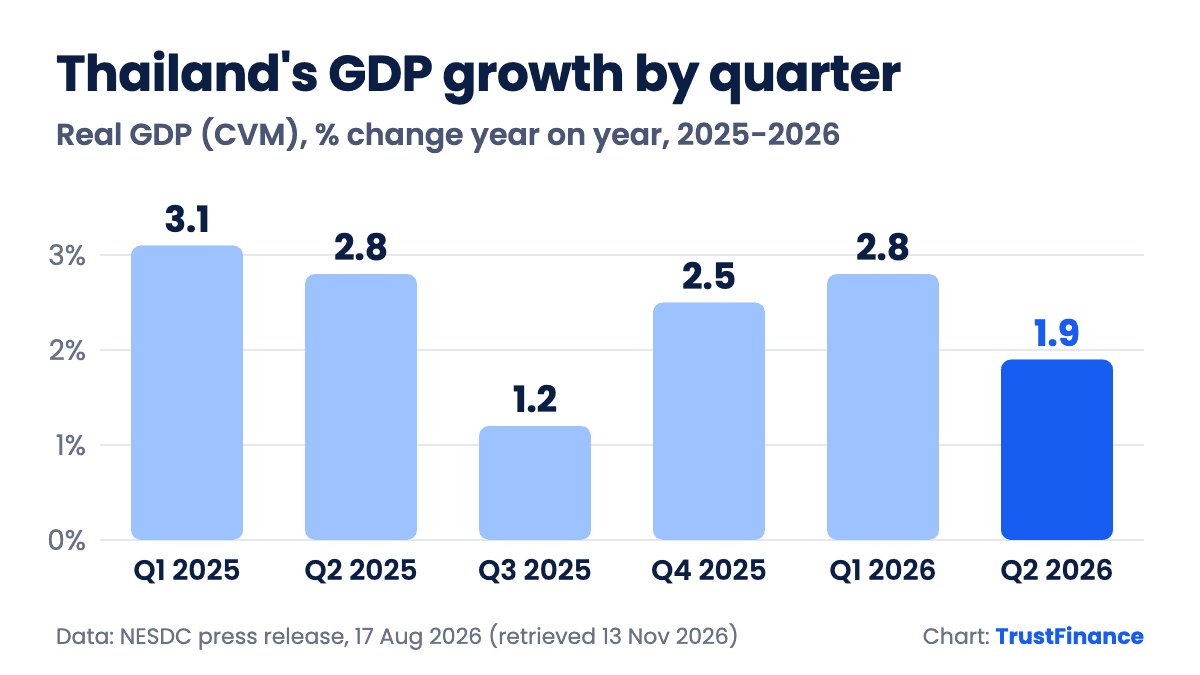
Image: Thailand's GDP growth by quarter (%YoY) · Source: NESDC, Thai Economic Performance in Q2 2026 (released 17 Aug 2026), page 2 (retrieved 13 Nov 2026) · Chart by TrustFinance
Another point worth noting: NESDC narrowed its 2026 forecast range from 1.5% to 2.5% in its May release to 2.0% to 2.5% in its August release. In other words, the agency that produces the numbers sees the full year more positively, even though growth slowed in the second quarter.
Breaking the numbers down with the C + I + G + (X - M) formula shows what pulled Thailand's growth up this quarter and what held it back.
| Component (Thailand, Q2 2026) | Variable in the formula | YoY change |
|---|---|---|
| Private consumption | C | +1.9% |
| Private investment | I | +13.4% |
| Public investment | I (government share) | -1.6% |
| Government consumption | G | +0.2% |
| Value of goods exports (USD) | X | +17.6% |
| Value of goods imports (USD) | M | +42.3% |
Source: NESDC press release, 17 August 2026 (export and import figures based on the Bank of Thailand's balance of payments data)
The picture is that private investment picked up strongly, but imports grew much faster than exports, so the X - M component pulled GDP down. This is how you use the GDP formula to read real news, not just memorise it.
GDP per capita is GDP divided by the population. It is used to compare average income levels between countries or between years. According to NESDC's table, Thailand's per capita income in 2025 was 269,615 baht per person per year, or about USD 8,200. Remember, though, that this is an average. It does not mean every person in Thailand earns this much.
NESDC projects that Thailand's per capita income will be about 279,602 baht, or USD 8,472.8, in 2026. Note that the dollar figure also depends on the exchange rate. If the baht strengthens, GDP per capita in dollars looks higher even though income in baht has not changed. That is why economists comparing countries often also look at GDP per capita on a PPP basis, which adjusts for the cost of living.
NESDC reports on the Thai economy once a quarter, about a month and a half after the quarter ends. This year, the first-quarter figures were released on 18 May and the second-quarter figures on 17 August. If the usual timing holds, the third-quarter figures should come out around mid-November, but check the exact date on the NESDC website. In each release, NESDC usually revises its full-year forecast too, and markets pay as much attention to that as to the quarterly number.
Now that you know what GDP is, try these 5 steps every time you see a GDP headline.
|
All 5 steps take less than 10 minutes, but they help you read the news more deeply than the headline, because headlines tend to pick the one number that looks most exciting.
| Approach | What is added up | Question it answers | Who uses it most |
|---|---|---|---|
| Production | Value added by each sector | Which sectors are growing and which are slowing | Industry planners |
| Income | Wages, profits, interest, rent | Whether income goes to labour or capital | Labour and tax researchers |
| Expenditure | C + I + G + (X - M) | Whose spending is driving the economy | Investors and market analysts |
GDP is a good measure of the size of an economy, but it has several blind spots.
|
None of this means GDP is useless. You just need to know that it answers "how big is the economy and how fast is it growing" well, but answers "are people better off" only partly. That is why many countries also look at other indicators, such as household debt, the unemployment rate or inequality indexes.
Markets do not react to the GDP number alone. They react to the "gap" between the actual figure and what the market expected. If GDP comes in better than expected, investors may see less reason for the central bank to cut interest rates, and that country's currency may strengthen in the short term. If it comes in worse than expected, the picture may reverse.
Keep in mind that this reaction is not always the same. Sometimes the number is good but the market falls, because what matters is in the details, such as forecast revisions or other news released at the same time. For US GDP, markets usually read it alongside Federal Reserve decisions (read more about the FOMC).
Caution: When major economic figures are released, asset prices can be more volatile than usual. Anyone trading assets should assess their own risk carefully. |
It also helps to know that GDP is a slow number. By the time it is released, almost two months have passed since the quarter ended. Markets therefore try to anticipate it using data that comes out sooner, such as monthly exports, industrial production indexes or confidence indexes. Once you understand what GDP is and when it is released, you can see why markets sometimes barely move on release day: prices have already reflected the information.
This article is for general education only. It is not personalised investment advice and does not promise any return. Readers should do their own research and assess their own risk before making any decision. |
GDP stands for Gross Domestic Product. It is the value of all final goods and services produced within a country over a given period, and it is used to measure the size and growth of an economy.
GDP per capita is GDP divided by the population. It shows average income per person and is used to compare levels of development between countries. Thailand's figure for 2025 was 269,615 baht per person per year, according to NESDC, but it is an average that says nothing about inequality.
GDP is based on location: output is counted for the country where it is produced. GNP is based on the nationality of whoever owns the factors of production. So the income of Thai people working abroad counts in Thailand's GNP, but not in Thailand's GDP.
The expenditure formula, GDP = C + I + G + (X - M): private consumption plus investment plus government spending plus net exports. It is used most often because it clearly shows what is driving the economy.
NESDC releases Thailand's GDP every quarter, about a month and a half after the quarter ends. In 2026, the first-quarter figures were released on 18 May and the second-quarter figures on 17 August, together with a revised full-year forecast.
According to NESDC data released on 17 August 2026, Thailand's GDP grew 2.4% in 2025 as a whole. For 2026, growth is expected to be 2.0% to 2.5%. In the first half of the year, GDP grew 2.8% in the first quarter and 1.9% in the second.
Not always. GDP growth means the economy as a whole is producing more. But if the population grows faster, or income is concentrated in certain groups, most people's income may not rise with it. It is better to look at GDP per capita and income distribution indicators as well.
If YoY GDP growth is negative, the economy is smaller than in the same period last year. If seasonally adjusted QoQ growth is negative for two quarters in a row, many people call it a technical recession. It is a warning sign, not an official verdict.
To sum up what GDP is in one sentence: it is the value of final goods and services produced within a country, it can be measured in 3 ways, and the figure in the news is the growth rate of real GDP. To read the news correctly, separate YoY from seasonally adjusted QoQ, separate nominal from real, and check how far the actual figure is from what the market expected.
The next time NESDC releases Thailand's figures, open the C + I + G + (X - M) table and look for yourself. You will get a much clearer picture of the Thai economy than from the headline alone. And if someone asks what GDP is and why it matters, the answer is that it is the number central banks, governments and investors use as the starting point for their decisions. That is why it always affects our lives indirectly, through loan interest rates, jobs and the prices of the assets we hold.
TrustFinance
TrustFinance helps financial companies build credibility and traders make safer choices through verified profiles, authentic reviews, and research-driven insights.