Loading
Unlocking Market Structure Secrets: Understanding Liquidity, Strategies to Handle Market Traps, and Professional Practice Guidelines

TrustFinance
सित. 02, 2026
15 min read
3

In an era where global financial markets are inextricably linked, trading various assets—especially in the gold and oil markets—has seen an exponential surge in global interest. However, a common challenge analysts and market participants face is managing Stop Losses. Often, we observe a phenomenon where the price moves to hit our Stop Loss perfectly, only to violently reverse and move in the direction we initially predicted.
This phenomenon is not bad luck, random volatility, or chart manipulation by platforms. Rather, it is a natural mechanism of massive markets driven by the principle of "Liquidity." This article will take you on a deep dive into market structure, explore the concept of retail traps, and offer fresh perspectives on applying this knowledge through internationally standardized trading platforms as a risk-free space for practice and skill development.
Understanding Market Structure and Liquidity Mechanisms
To truly understand price movements, we must view the market from the perspective of large financial institutions, global funds, or central banks—collectively referred to as "Smart Money." These market participants handle massive order volumes. They cannot simply enter or exit a position with a single click like retail traders. Doing so would severely disrupt market prices, giving them highly unfavorable entry costs.
Therefore, large institutions must rely on "Liquidity"—a sufficient volume of opposite-side orders to absorb their massive trades. Where does this liquidity come from? One of the most frequently mentioned sources is the "Stop Loss" orders of retail market participants.
Most traders tend to place their Stop Losses just above previous Swing Highs or below previous Swing Lows. This clustering of orders creates massive "Liquidity Pools" on the order book. From the perspective of this concept, financial institutions can identify these high-liquidity areas and place large orders in the opposite direction, triggering a Liquidity Sweep or Stop Loss Hunting. This is not a malicious attack targeting retail traders; rather, it explains that such movements are driven by necessities such as:
- Filling Large Positions: Enabling institutions to match their massive orders at their desired price levels.
- Creating Market Momentum (Create Liquidity): When massive stop orders are triggered, it generates sufficient momentum to drive the price in its true direction.
- Removing Weak Traders: This process shakes out certain participants from the market before the primary trend officially begins.
What is a Retail Trap? Common Patterns
The term "Retail Trap" refers to price movement patterns designed to lure retail participants into disadvantageous positions. Understanding these patterns helps analysts avoid poor decisions and plan effective countermeasures. Common patterns seen on charts include:
1. Bull Trap
This occurs when the price surges past a key resistance level or a previous high. This behavior lures trend-following traders into quickly opening Buy positions, believing a new uptrend has begun. Simultaneously, this breakout triggers the Stop Losses of those holding Sell positions. Once the liquidity in this area is absorbed, the price reverses rapidly downward, leaving buyers trapped at the peak in a difficult situation.
- Example: The US100 index tests a major resistance at 18,000 points multiple times. When buying pressure pushes the price through to 18,050, retail traders notice the breakout and rush to Buy. Meanwhile, those with Sell positions hit their Stop Losses (which automatically trigger Buy orders). At this exact moment, large institutions use this surge in buying pressure to distribute their massive Sell orders, quickly dragging the price back down to 17,900. Breakout buyers are instantly trapped in a losing position.
2. Bear Trap
Conversely, a Bear Trap occurs when the price plummets below a key support level or previous low. The illusion of a collapsing market induces panic selling and attracts trend-followers to open Sell positions. When these sell orders are matched with the buy orders of waiting institutions, the price rebounds rapidly, leaving short sellers trapped at the lowest price points.
- Example: Crude Oil (OILCash) has a major support at $75 per barrel. Negative factors push the price down to $74, causing retail panic and a rush of Sell orders, anticipating a downtrend. However, waiting institutions use this opportunity to accumulate Buy positions. Once the selling pressure is absorbed, the oil price is pushed back above $76, leaving short sellers facing heavy losses.
3. Equal Highs and Equal Lows (EQH/EQL)
Another crucial concept involves Equal Highs (EQH) and Equal Lows (EQL). To the average analyst, these areas might look like strong, reliable support or resistance. However, from a liquidity mechanism perspective:
- EQH (Equal Highs): Serves as a pool of Buy-side Liquidity, combining the Stop Losses of sellers and the pending Buy orders of breakout traders.
- Example: Gold (GOLD) rallies to test resistance at $4,400 twice (Double Top pattern). Retail traders view this as strong resistance, open Sell positions, and place Stop Losses slightly above at $4,405. Institutional investors may push the price to $4,406, creating a Fake-out to sweep the stop losses (using the buy-side liquidity to fill their orders) before heavily selling and driving the price down in its true direction.
- EQL (Equal Lows): Serves as a pool of Sell-side Liquidity, generated by the Stop Losses of buyers.
- Example: Gold drops to test support at $4,350 twice (Double Bottom). Most traders assume this support will hold, enter Buy positions, and place Stop Losses below at $4,345. Institutions might let the price briefly spike down to $4,344 to sweep the stop losses, forcing retail traders out of the market (using sell-side liquidity to fill institutional Buy orders). Once liquidity is swept, they drive the price upward.
According to liquidity concepts, EQH and EQL zones are primary targets for the market to test and sweep before a genuine trend reversal occurs.
What is a Liquidity Sweep? How to Identify False Breakouts
The core of analyzing this principle is distinguishing whether a price breaking a key level signifies a genuine new trend or is merely a Liquidity Sweep.
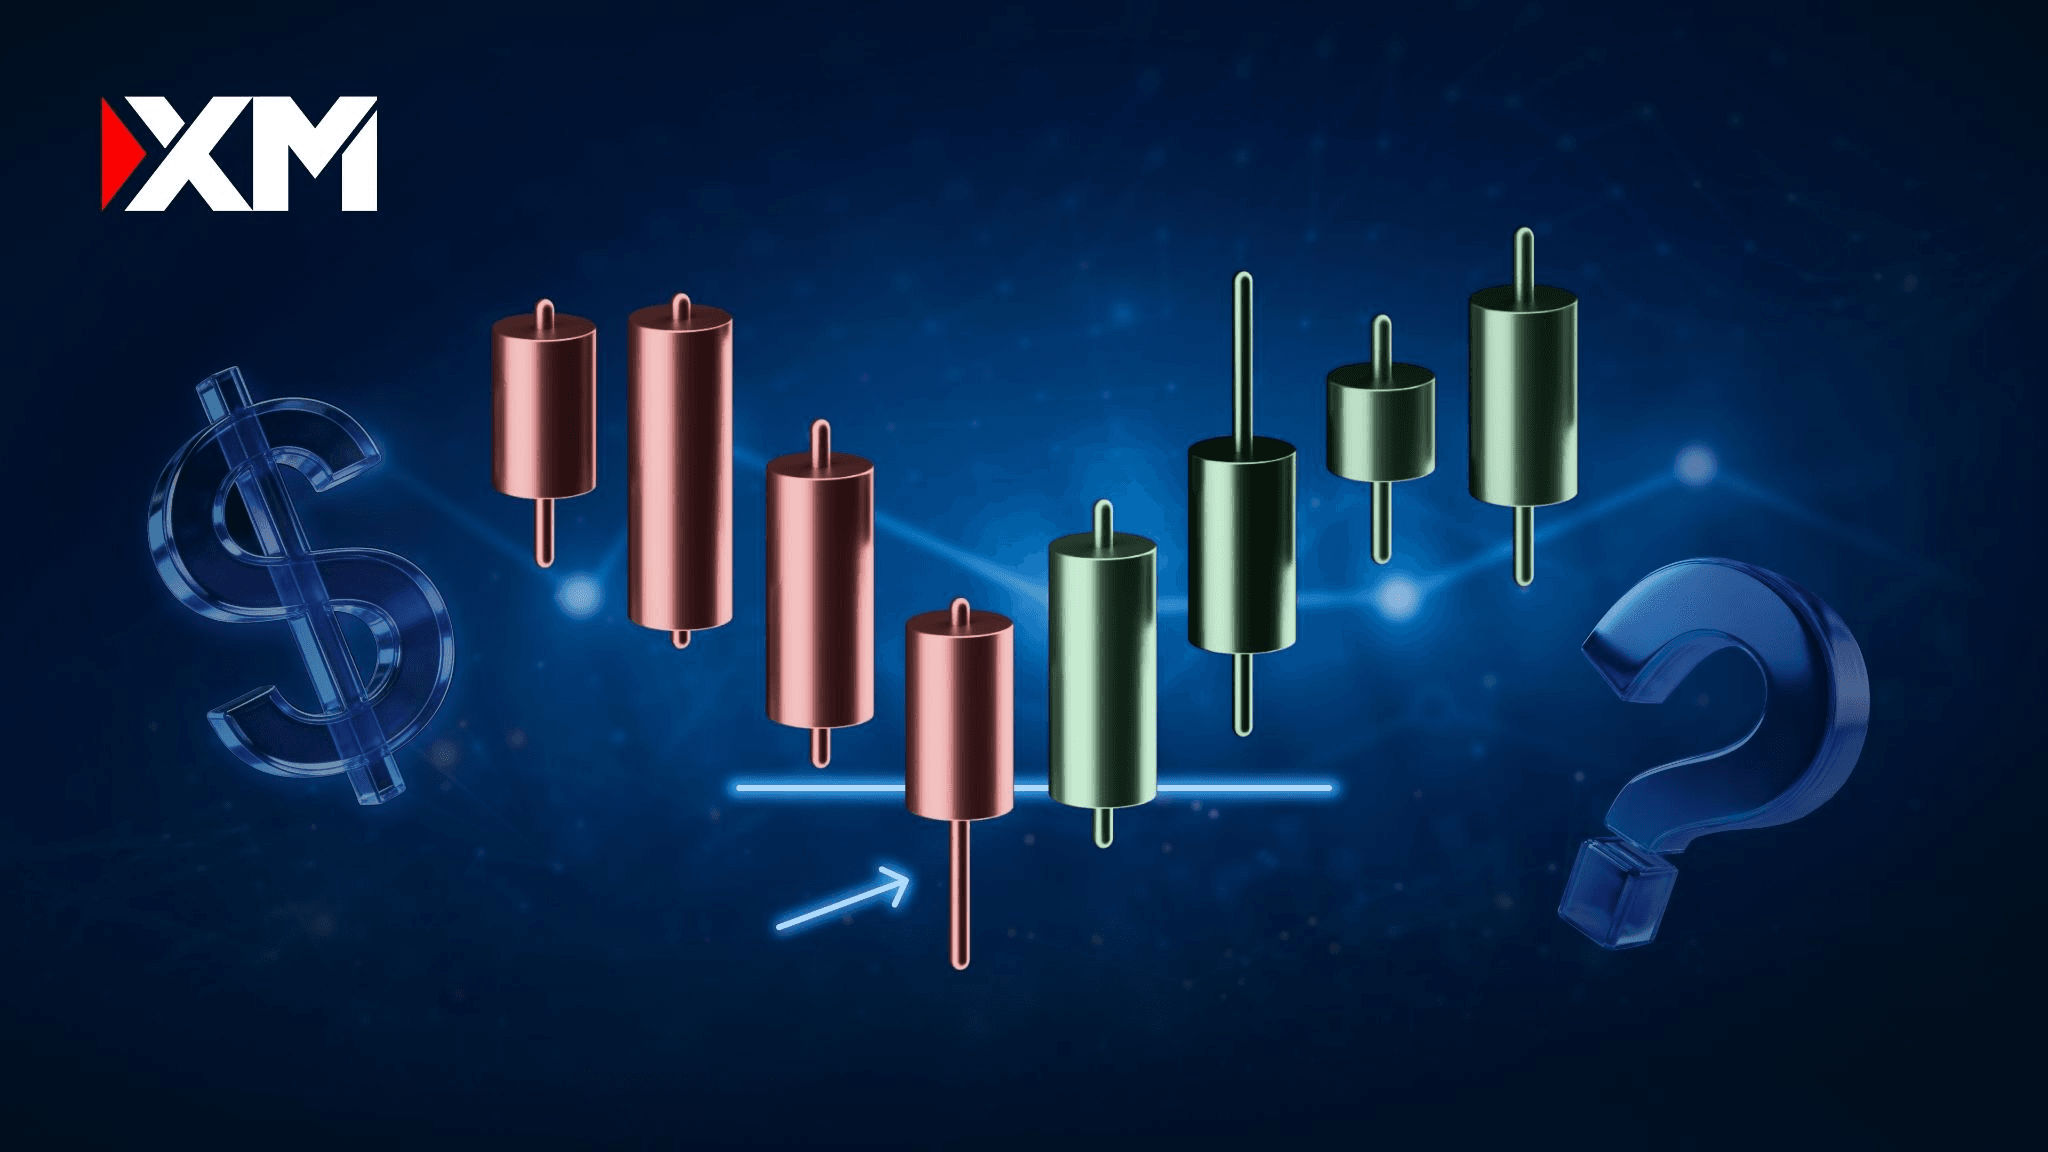
A Liquidity Sweep occurs when the price temporarily breaches a key support or resistance level to trigger Stop Loss orders before immediately reversing. A complete sweep typically involves three main components:
- Clear Price Levels: Such as the Previous Daily High/Low (PDH/PDL) or Session High/Low.
- Piercing with Wicks: The price rapidly spikes through the level.
- Aggressive Price Rejection: After the breach, the price is swiftly pulled back into the original zone.
The Difference Between a False Breakout (Sweep) and a True Breakout: A reliable method to spot the difference is analyzing the "Closing Price" and candlestick anatomy:
- Liquidity Sweep: The candlestick leaves a long wick extending beyond the key level zone, but the body ultimately closes back within the original boundaries.
- True Breakout: The candlestick body clearly closes outside the key level zone and typically retests that level before continuing steadily in the breakout direction.
Deep Dive into Smart Money Concepts (SMC) for Beginners
To fully grasp market analysis, one must study the "Smart Money Concept" (SMC), an analytical framework evolved from the Inner Circle Trader (ICT) theory. SMC is an analytical system focused on tracking the transaction footprints of financial institutions, rather than relying solely on traditional Technical Indicators.
Core SMC concepts for beginners include:
- Order Block (OB): Simply put, an OB is the last candlestick before a massive, impulsive price move. In SMC theory, this area reflects where financial institutions or major players accumulated their orders. When the price returns to test this Order Block in the future, it acts as a highly significant support or resistance level.
- Fair Value Gap (FVG): An FVG is a price gap created when the market moves rapidly and aggressively in one direction, causing an imbalance between buying and selling pressure across a 3-candle sequence. Theoretically, the market tends to draw the price back to fill these gaps and restore balance before continuing its move.
- Market Structure Shift (MSS): This is a signal SMC users look for to determine if the market's primary structure has changed direction. It is usually observed after a Liquidity Sweep. If the price sweeps liquidity and then successfully breaks the previous high or low, it confirms a shift in momentum.
- Inducement: A concept explaining price patterns designed to lure market participants into entering trades at disadvantageous points. It induces retail traders to make mistakes, ultimately turning them into liquidity for the big players.
Integrating these concepts allows analysts to see the logical "story" behind price chart volatility, helping them understand patterns that SMC considers traps laid by major players.

Market Hours and Their Connection to Liquidity
Knowledge of chart structure alone is insufficient without understanding time dynamics. Trading volume and volatility are not consistent throughout the day. Understanding market hours is a critical variable in avoiding market traps.
- For popular instruments like Gold (GOLD), trading hours are from 06:05 to 04:55 the following day (Thailand Time), totaling 22 hours, with an early Friday close at 04:50 Saturday morning (Thailand Time).
- Oil (OilCash) operates between 06:05 and 04:50 the following day (Thailand Time), with overnight Rollover fees calculated between 06:55 and 07:05 (Thailand Time).
- US Stock Indices like US30, US100, and US500 open from 05:05 to 04:00 the following day (Thailand Time).
- Only digital alternative instruments allow for 24/7 analysis and trading, with a brief maintenance period on Saturdays from 15:05 to 15:35 (Thailand Time).
Analyzing these hours connects to the "Kill Zone" concept, identifying periods of high trading volume and increased chances of liquidity sweeps:
- London Kill Zone (approx. 09:00 – 12:00 TH Time): We often see false price moves (Judas Swing) at the London open to sweep liquidity and misdirect the market before reversing.
- New York Kill Zone (approx. 19:00 – 22:00 TH Time): This is the period of peak trading volume. Price direction often becomes much clearer during this time, following the liquidity sweeps of the London session.
- Asian Session: Usually a time of tight consolidation. According to SMC, this session often creates "Inducement" patterns rather than forming major trends.
Managing Platform Selection Errors
No matter how excellent your knowledge and strategy, real-world execution faces challenges from external variables. Market participants frequently encounter three main errors when choosing a trading platform:
- Account Limitations: Some platforms impose complex conditions, such as restricting certain strategies, enforcing minimum holding times, or complicating position adjustments. This severely hinders the practical application of advanced theories like SMC.
- Unclear Pricing Structures: Inconsistent spread widening and abnormal expansion during major news events can unnecessarily trigger meticulously calculated Stop Losses.
- Hidden Fees: Costs not transparently displayed upfront—such as deposit/withdrawal fees, commissions, swaps, and account maintenance fees—directly impact long-term capital management efficiency.
To counter these issues, choosing a highly professional platform provider is paramount. Consider platforms regulated by relevant international bodies, which indicates transparency and operational standards. Furthermore, user-friendly interfaces and comprehensive analytical tools ensure smooth responses to market conditions.
Most importantly, in a highly volatile analytical environment, a Negative Balance Protection feature serves as a crucial psychological shield, ensuring your risk is strictly limited to the capital you have defined.
Step into Risk-Free Practical Execution via the XM Demo Competition
Theoretical understanding of liquidity and SMC is only the beginning. The real challenge is applying this knowledge in live, moving markets. Making decisions under the pressure of time and rapidly moving charts requires significant "flight hours" and rigorous practice.
How can we practice handling market traps and test these strategies without risking personal capital? The best modern solution is utilizing demo accounts.
However, standard demo accounts often fail to simulate the emotional pressure of real environments. This is where a recognized, top-tier trading platform like XM offers a unique solution through the XM Demo Competition.
Why is the Demo Competition the Ultimate Training Ground?
- Realistic Pressure: The presence of a Leaderboard and weekly time limits creates an environment with pressure closely mirroring real-market liquidity sweeps—a feeling standard demo trading cannot provide.
- Zero Cost Risk: Traders start with $1,000 in virtual funds, allowing you to fully test SMC strategies, observe Judas Swings, or wait for entry confirmations without the fear of losing real money.
- Measured by % Growth: The scoring system, featuring a 20% Max Loss rule, focuses on percentage growth rather than absolute monetary amounts. This encourages participants to prioritize risk management and strategy precision over reckless risk-taking. If losses exceed the limit, the system automatically removes you from the competition.
- Real, Withdrawable Prizes: Despite trading with virtual funds, the rewards are real—totaling over $25,000 per week for the top 100 winners. First place can win up to $1,500 in cash. Prizes won from this competition can actually be withdrawn, truly rewarding developed skills.
Participating in the XM Demo Competition is the perfect goal for those who want to study market behavior during Kill Zones and apply strategies to overcome market traps, all backed by a world-class platform.
Frequently Asked Questions (FAQ)
1. What is the difference between a Sweep and a True Breakout?
The main difference lies in candlestick closing behavior. A Liquidity Sweep leaves a wick piercing the support/resistance zone temporarily to grab liquidity before the body closes back in the original zone. In a True Breakout, the candle body clearly and firmly closes outside the zone.
2. Where should I place a Stop Loss to avoid getting swept?
No placement is 100% safe. However, avoiding placing Stop Losses exactly tight against Swing Highs/Lows reduces risk. SMC experts often recommend placing the Stop Loss with a volatility buffer above or below the next Order Block zone.
3. Can the Demo Competition really help me practice SMC?
Yes, absolutely. The mechanics of the Leaderboard and the weekly time limit generate emotional pressure akin to live trading. This allows users to hone their decision-making skills under stress without bearing financial risk.
4. What is a Judas Swing?
A Judas Swing is an ICT term describing a false price move that typically occurs right at the London Open. Its purpose is to sweep liquidity and deceive the market regarding direction before reversing to its true path during the New York session.
5. How do I identify an FVG?
A Fair Value Gap (FVG) is identified by observing a rapid 3-candlestick sequence. Look for the gap between the wick of the 1st candle and the wick of the 3rd candle. When these wicks do not overlap, it creates an area of price imbalance in the middle (the 2nd candle). This specific area is the FVG.
The liquidity sweep phenomenon is not negative market interference; it is a natural market structure that traders can learn and decode. Once you understand these mechanisms, you can plan strategies much more meticulously. For a solid and secure first step, applying Smart Money Concepts within a demo environment is an excellent way to practice without risking real capital.
Ready to Push the Limits of Your Analysis?
Open an account today to seize the opportunity to celebrate success with award-winning services from leading global institutions. XM offers over 1,400 instruments to choose from and fully-featured trading platforms, including 10 platforms, both the XM app for iOS and Android, as well as the popular MT4 and MT5 platforms. Join 20 million clients who trust XM, a comprehensive world-class All-in-One platform regulated by multiple authorities. Enjoy instant peace-of-mind withdrawals. Stay updated by following XM on Facebook, Instagram, and TikTok. Visit their website for more information.
Our services carry a high level of risk and can result in the loss of your invested capital.
*Terms and Conditions apply.
Please note that each product may vary depending on the specific XM entity. For more information, please visit the XM website.
Written by
TrustFinance
TrustFinance helps financial companies build credibility and traders make safer choices through verified profiles, authentic reviews, and research-driven insights.
Tags:
Best pick of the Week
Related Articles